
#NephJC Chat
Tuesday May 28 9 pm Eastern
Wednesday May 29 9 pm Indian Standard Time
Wednesday May 29 8 pm BST, 12 noon Pacific
JAMA Intern Med. 2019 Apr 13. doi: 10.1001/jamainternmed.2019.0600. [Epub ahead of print]
Evaluating a New International Risk-Prediction Tool in IgA Nephropathy.
Barbour SJ, Coppo R, Zhang H, Liu ZH, Suzuki Y, Matsuzaki K, Katafuchi R, Er L, Espino-Hernandez G, Kim SJ, Reich HN, Feehally J, Cattran DC; International IgA Nephropathy Network.
PMID: 30980653


Introduction
IgA nephropathy is the most common type of glomerulonephritis, affecting 1.5 of 100,000 individuals per year and making up 1-3% of all cases of end stage kidney disease. The prevalence is highest in Asian countries, where it comprises 30% of all kidney biopsies (and 45% of glomerulonephritis cases), compared to 5% of biopsies in the United States and Europe. Patients with IgA nephropathy often present with microscopic hematuria), which may not be brought to clinical attention for months or years. Other clinical presentations are similarly non-specific often leading to a delay in diagnosis. These include abdominal pain, hypertension, and proteinuria.
There is a large variability in outcomes in patients with IgA nephropathy, with a 10 year risk of end-stage kidney disease averaging around 30-40% worldwide. Immunosuppressive therapy is recommended for high risk patients, but what constitutes high risk is not well-defined. Three quarters of patients with IgA nephropathy are considered low risk by clinical criteria and are not placed on immunosuppressive therapy. In a prior study from the authors one-third of patients who were considered low risk clinically had high risk kidney biopsies (by MEST scores). This could indicate that IgA nephropathy patients who do not get a kidney biopsy may be under treated based on clinical parameters and laboratory values. A combination of clinical, laboratory, and pathologic data could better predict patient outcomes in IgA nephropathy.
Prior prediction models have several limitations that affected their usefulness to nephrologists. These included small cohort size, limited ethnic diversity, and use of clinical variables requiring a long follow-up. In addition, histologic scoring systems were not validated worldwide. There are no clinical prediction tools to date that can predict disease progression accurately in patients with IgA nephropathy, and so the authors sought to fill this unmet need.
Clinical trials in IgA nephropathy
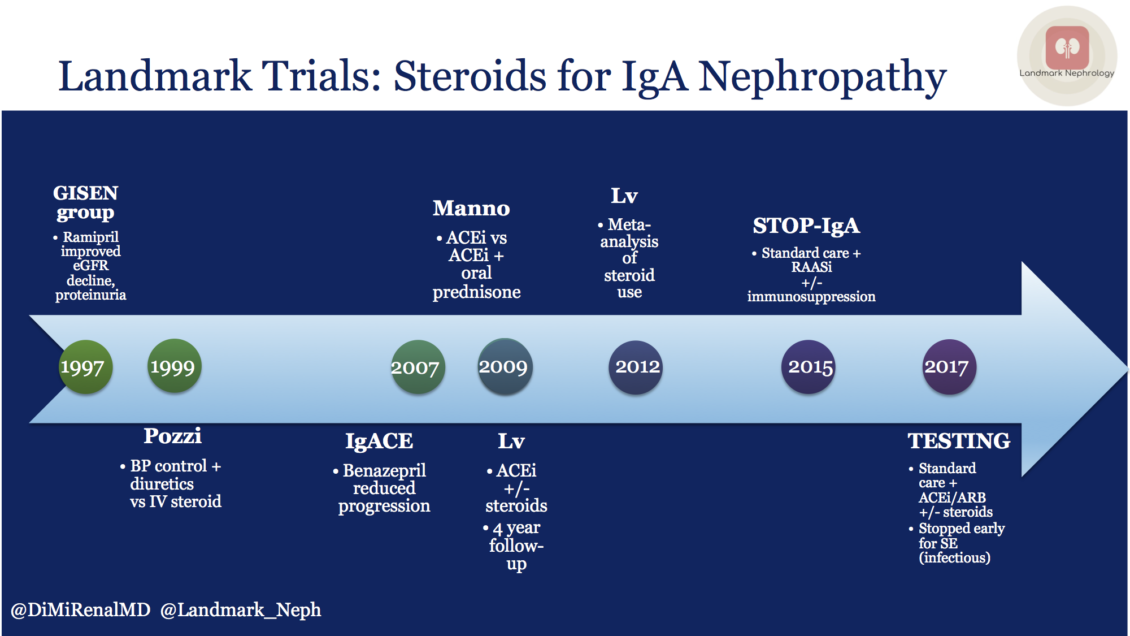
Multiple trials have evaluated steroid use in IgA nephropathy with limited clinical benefit, the last two of which have been discussed on NephJC. The STOP-IgA trial was unequivocal in the lack of benefit, while in TESTING, the benefit was overshadowed by the steroid adverse effects. The lack of efficacy could be due to the failure to identify at-risk patients, with many patients in both the treatment and control groups not showing progression of disease during the study period.
A review of IgA nephropathy steroid trials over the past two decades was recently highlighted in the Landmark Nephrology series by Diana Mahbod.
Risk stratification is needed
Histopathologic prediction tools, based on scoring parameters on kidney biopsies, has been associated with the risk of progression of kidney failure. The most common is the Oxford MEST-C scoring system (see the NephJC coverage of the addition of ‘C’ to the MEST here). The Oxford classification of IgA nephropathy was created using diverse cohorts from Europe, Asia, North America, and South America; but was later only validated within North America. This scale should be validated in many countries to cover diverse ethnicities in order to be used internationally. By including MEST classification of kidney biopsies within the prediction algorithms of this study, the authors were able to validate the scoring system in additional cohorts. Beyond histology, other known risk factors for poor prognosis in IgA nephropathy include:
Male sex
Proteinuria >1 g/d
Hypertension
Reduced GFR
Hyperuricemia
The ability to risk stratify IgA nephropathy patients could inform treatment decisions, improve clinical trial recruitment, and assist in biomarker validation. Clinical trials in IgA nephropathy have failed to meet their endpoints and a clinical prediction tool could assist in identifying treatment candidates. To meet this need, the International IgA Nephropathy Network performed a multinational study to make and validate a risk prediction scale based on clinical and laboratory data, as well as the Oxford classification (MEST score) of the kidney biopsy.
The Oxford Classification and MEST scoring of kidney biopsies
Histopathologic scoring of kidney biopsies was performed using the MEST score from the Oxford classification. MEST scoring includes:
Mesangial hypercellularity; diffuse, involving greater than 50% of glomeruli
Endocapillary hypercellularity: any, even if limited to a single loop of a single glomerulus
Segmental sclerosis: any
Tubular atrophy and interstitial fibrosis: 25-50% cortex, >50% of cortex
Mesangial hypercellularity, endocapillary hypercellularity, and crescent formation are histopathologic indicators of activity, while segmental sclerosis and tubular atrophy indicate chronicity.
The Study
Study design:
The cohorts were retrospectively studied using data collected from previous research, as well as an additional cohort in Japan. All patients were adults, had biopsy-proven idiopathic IgA nephropathy, MEST scoring, and at least 5 years of follow-up after biopsy.
Patients were included from:

There were two phases of forming this risk stratification tool: derivation and validation. Separate cohorts were used in validation than derivation, which provides external validation to improve the overall prediction strength.
Prediction models:
Four separate risk prediction models were made and tested, which ended with two full models used to create web-based and app-based prediction calculators.
The clinical model included eGFR, proteinuria, and mean arterial pressure at the time of biopsy.
The limited model included the clinical model criteria plus the MEST score of the kidney biopsy.
The full model included all of the parameters of the limited model and added age, sex, ethnicity, BMI, crescents, immunosuppression, and renin-angiotensin system blockade at the time of biopsy.
The second full model included all of the above parameters except race/ethnicity, as it was not relevant in some populations (Chinese and Japanese cohorts are ethnically more uniform than North American or European cohorts).
Primary outcomes:
ESKD, as defined by GFR <15 mL/min, or requirement of renal replacement therapy (dialysis, transplantation)
Loss of at least 50% of GFR from the time of biopsy (kidney-related surrogate end-point)
Statistics:
The Cox proportional hazards model was used to analyze the time from kidney biopsy to the primary outcomes (see more on Cox models here).
The clinical, limited, and full models were assessed using multiple parameters to predict model fit. These included:
R2D – A regression statistic that transforms effect sizes into correlations. The effect size is the difference between the mean outcomes from two different intervention groups (or in this case, models). It does not account for variability within each individual group.
Akaike Information Criterion (AIC) – a quality estimator of the statistical models for a given set of data; lower values mean the model is more parsimonious when comparing to another model. The comparisons are valid whenever the models are looking at the same response.
Discrimination (C statistic adapted for censoring) – C-statistics are “concordance statistics”, and represent the area under a receiver operator curve. C-statistics show the goodness of fit determined by logistic regression.
Net reclassification improvement – This statistical measure assesses the relative ability of 2 risk models to distinguish between low and high risk individuals. It is useful to discriminate between events and non-events and can differentiate between upward and downward risk in a model.
Calibration plots

Good performance of a clinical prediction tool is shown with a high R2D, lower AIC, increased discrimination / higher C-statistics, continued performance or improvement on re-classification, and fit upon calibration plots (see image above).
The TRIPOD guidelines for risk prediction models were also used. TRIPOD is Transparent Reporting of a multivariable prediction model for Individual Prognosis Or Diagnosis. These are guidelines used to increase transparency in studies creating clinical prediction models. The TRIPOD guidelines require completion of a checklist of items in production of a clinical prediction model, included in the table below:

TRIPOD criteria for risk prediction models, from Collins et al , BMJ 2015
Results
Derivation cohort:
3067 patients were identified from the VALIGA, Nanjing, and Tokyo cohorts that were screened, and 2781 patients met the inclusion criteria for the study. The inclusion criteria included age >18 years, absence of ESKD at the time of biopsy, and having baseline and follow-up eGFR measurements. 15% of patients experienced a 50% decline in GFR or ESKD at 5 years, meeting the primary outcome. A majority of patients were on renin-angiotensin system blockade at the time of (or shortly after) biopsy (87%), consistent with the KDIGO recommendations to initiate renin-angiotensin system blockade in IgA nephropathy patients. The enrollment flowchart for the derivation cohort, as well as the validation cohorts thereafter, are included in figure 1A of the manuscript.

Fig 1A from Barbour et al, JAMA IM 2019
The derivation and validation cohorts had a similar proportion of cases reach the primary outcomes (14.7% derivation versus 13.3% validation). The differences between cohorts were not significant, as determined by log-rank tests.

Fig 1b from Barbour et al, JAMA IM 2019
The characteristics of the derivation and validation cohorts are shown below in Table 1. There were no significant differences in serum creatinine, GFR, mean arterial pressure, proteinuria, BMI, use of renin-angiotensin system blockade, or of primary outcomes. The validation cohort had a different ethnic distribution than the derivation cohort, with more Japanese and fewer Caucasian patients.

Table 1 from Barbour et al, JAMA IM 2019
The clinical model had poorer model fit, as determined by a lower R2D, higher AIC, lower C statistics, and poorer re-classification, as shown in table 2 below.

Table 2 from Barbour et al, JAMA IM 2019
The MEST biopsy parameters were included in the limited and full models, and improved prediction. A previous study by the same group had already shown improvement in risk stratification in IgA nephropathy through inclusion of MEST scoring. Interestingly, although crescents are included in the current Oxford classification (MEST-C) score, crescents did not make it into the prediction models (were below the p value threshold). A multivariable analysis identified crescents to be associated with ethnicity and immunosuppression following the biopsy (see eTable 4 and 5).


Validation cohort:
In the validation cohort, 1146 of 1564 patients were studied that met all inclusion criteria, combining the Oxford derivation, Oxford validation, Beijing, and Fukuoka cohorts.
There was a better R2D for the validation cohort when compared to the derivation cohort (35.3% versus 26.3%). There was better discrimination than the derivation analysis, when comparing the slopes of the calibration curves. The C statistics were equivalent between the groups. Similar results were seen with or without the inclusion of race / ethnicity as a parameter.

Figure 2 from Barbour et al, JAMA IM 2019
The patients were stratified into low, intermediate, higher risk, and highest risk groups. Higher risk included a steeper decline in GFR and an increased 5 year risk of GFR < 50% of baseline or development of end-stage kidney disease. Although the baseline GFR was not included as a component of the full model, a more rapid rate of GFR decline was associated with a worse prognosis as suspected.

Table 3 from Barbour et al, JAMA IM 2019
Discussion
From the data from this study, the authors produced and validated 2 full models for prediction of ESKD or >50% GFR decline in patients with IgA nephropathy. One full model included race, and the other left off this parameter for cases in which the race / ethnicity is unknown. Given that the International IgA Nephropathy Network included a diverse sample, the prediction models can be potentially used worldwide. They also allow race/ ethnicity to be used as a predictor variable, since there is an increased risk of progression of IgA nephropathy in certain groups (e.g. Asian populations).
The parameters used for risk prediction include:
Age
Ethnicity
Blood pressure
GFR
Proteinuria
Use of renin-angiotensin system blockade
Use of immunosuppression
Pathologic variables (MEST-score)
The ability to predict prognosis of IgA nephropathy can improve clinical trials by allowing enrollment of higher risk patients, improving the power of the study. This could allow smaller, cheaper and shorter trials of biomarkers, therapeutics and other ideas.
Limitations
Generalizability:
The cohorts studied were entirely adult patients, and so the prediction models cannot be applied to pediatric patients.
Despite being multiethnic, it mainly included cohorts of white, Chinese and Japanese patients. Other ethnicities develop IgA nephropathy.
The prediction models are limited to biopsy-proven IgA nephropathy and the full models cannot be applied in patients who have not undergone biopsy.
Treatment Decisions:
While the risk prediction model seems useful for prognosis, it should not be taken to make treatment decisions. If a future trial shows that, say, a certain prediction risk predicts a favorable risk:benefit profile for immunosuppression, then one might use it for therapeutic decisions. This cautionary note is also emphasized by Prof. Feehally in the accompanying author commentary.
Meanwhile, what to make of the fact that these patients did receive immunosuppressive therapy after the biospy (43.5% in derivation cohort and 31% in the validation cohort)? Since this happens after the biopsy - this aspect is not included in the prediction model (which uses information available at the time of the biopsy, including biopsy findings). These therapeutic decisions in the cohorts were taken on the basis of the clinical presentation and the biopsy findings - and though they are not accounted for in the risk prediction model - they do effect the prognosis (and hence indirectly the risk prediction model). As an example, could crescents be not significant in the model - since these were treated aggressively and that improved their prognosis? One would be wise to tread carefully while applying this model until more trials are performed to guide us. Another way to put it is: since about 7-9% of the patients had been already started on immunosuppression at time of biopsy, and another 30-40% of the patients received immunosuppression after biopsy, these results do not portray the natural history of untreated IgA nephropathy.
Another approach: Machine learning
A recent study, which came out a few days after the current one, included the Nanjing cohort and used a machine learning algorithm to create a prediction model for IgA nephropathy. This study included 2047 patients (1022 derivation and 1025 validation) and 8 years of clinical follow-up. They utilized XGBoost, which generates decision trees in building a prediction model. They started with 36 variables, that later were reduced to 10 variables. The authors utilized this data to generate a prediction model (XGBoost) and a risk stratification model (SSM). While this study was not the first to use machine learning to predict progression of IgA nephropathy, it provided better risk prediction than a prior study that used only 6 variables. Their model is available here (link - but only in Chinese language). The current study includes the Nanjing cohort along with others to enhance applicability worldwide.
Can you apply this study’s results to your patients?

A web-based prediction tool and a corresponding mobile app was created with the parameters included within this study to assist in risk prediction for IgA nephropathy patients. This can be accessed by searching for the “International IgAN Prediction Tool” on QxMD at the link, or in the app and is free to use. There are 13 fields to enter for an outcome prediction to be made.
Prediction example using the app: A 40 year old Caucasian male with chronic kidney disease who has not received prior immunosuppressive or anti-proteinuric therapy recently underwent a kidney biopsy and was diagnosed with IgA nephropathy. He has a blood pressure of 160/95 mmHg, GFR of 65 mL/min, and 2.1 g proteinuria/day. A kidney biopsy shows a MEST score of M1E1S0T1. The 5-year risk of a 50% decline of GFR or development of ESKD is predicted by the app to be 16%.

Summary by Tiffany Caza, Nephropathology fellow, Little Rock
NSMC Intern, Class of 2019