
#NephJC Chat
Tuesday, October 24th, 2023 at 9 pm Eastern
Wednesday, October 25th, 2023, at 9 pm Indian Standard Time and 3:30 pm GMT
NEJM Evid. 2023, Sept 16 doi: 10.1056/EVIDoa2300107
Severe Hyponatremia Correction, Mortality, and Central Pontine Myelinolysis
Harish Seethapathy, M.D., Sophia Zhao, Ph.D., Tianqi Ouyang, M.P.H., Christie Passos, B.A., Adviti Sarang, B.S.A., Pui W. Cheung, M.D., M.S., Sushrut S. Waikar, M.D., M.P.H., David J.R. Steele, M.D., Sahir Kalim, M.D., M.M.Sc., Andrew S. Allegretti, M.D., M.Sc., Juan Carlos Ayus, M.D., and Sagar U. Nigwekar, M.D., M.M.Sc.
Full text: Link


Introduction
In the grand ballroom of medical knowledge, a nephrologist, with the grace of a seasoned dancer, might simply declare that hyponatremia reflects the poor balance between sodium ingestion and the amount of renal water excretion (Spasovski G, et al, Nephrol Dial Transplant 2014). The phrase “hyponatremia is the most common electrolyte disorder” resonates in the ballroom. Behind the elegance of numbers and formulas, there is a complex dance of hyponatremia algorithms. Exactly like highly skilled dancer, nephrologists spent decades perfecting their art: they precisely calculated rate, rhythm, pace, timing, and many other variables in correcting hyponatremia.
When serum sodium becomes imbalanced, the stakes are high. Hyponatraemia itself can cause increased intracranial pressure, impaired cerebral blood flow, and sometimes brain herniation. However, rapid correction of hyponatremia is a hypertonic stress to astrocytes, which can damage the cytoskeleton and break DNA, ultimately triggering apoptosis. The dancer trips, falls and is slow to get up!
The aftermath of a rapid sodium correction can be likened to a masquerade ball - highly variable in its presentations. One of its most feared outcomes is a biphasic illness called osmotic demyelination syndrome (ODS) (Sterns RH, N Engl J Med 2015). The first phase reflects gradual neurologic findings, and the second phase reflects ODS itself, which embraces central pontine myelinolysis (CPM) and extrapontine myelinosis (EPM) (LambeckJ, et al, Dtsch Arztebl Int 2019). Even if other risk factors are present, ODS is traditionally said to be secondary to the rapid rate of sodium correction in 67 to 88% of patients. (MacMillan TE, Am J Med, 2018, George JC, et al. Clin J Am Soc Nephrol, 2018)
Preliminary studies showed the link between ODS and rapid correction, and served as cautionary tale for nephrologists. Arrief AI’s 1986 study in NEJM highlighted the danger of rapid sodium correction in hyponatremia in fifteen young, healthy women who developed severe hyponatremia post-surgery, leading to seizures and respiratory arrest. At correction rates approximately an average of 23 mEq/l/24h), all suffered brain damage. With time, recommendations played it increasingly even safer. A review from 1986 suggested no ODS in patients with <12mEq/day correction rate. (Stern RH et al, NEJM, 1986), and then in the 90’s a case series suggested an even lower correction rate of 10-12 mEq in 24h was should be the new safe rate for preventing ODS (Karp BI, Medicine (Baltimore), 1993). Subsequently, the US guidelines went lower still, endorsing a serum sodium correction limit of 8 mEq/L in any 24-hour period for patients at high risk of ODS, (Verbalis JG, et al, Am J Med 2013) whereas the European guidelines recommend a daily limit of 10 mEq/L (Spasovski G, et al, Nephrol Dial Transplant 2014) for all. No matter the difference in methodology, both guidelines shared the same retrospective observational data foundation.

Now, after decades of slow correction being considered good medicine, a new challenge has begun to the old question. For example, MacMillan et al considered over 22,000 hospital admissions for hyponatremia under 130mmol/l, and found only 12 cases of ODS, with “common” risk factors such as hypokalemia and alcohol frequently present but with an inconsistent relationship to speed of sodium correction. This led the authors to conclude that “rapid correction of serum sodium is not causally related to ODS”. (MacMillan TE, et al, NEJM Evid 2023)
Another question that has been examined is whether slower correction rates are associated with differences in mortality in patients with hyponatremia. This was indeed shown in the MacMillan paper above, and also in a retrospective cohort analysis, including over 1000 ICU patients with a median Na of 116 mEq/L, which showed lower in hospital mortality with rapid correction (absolute difference -4.37%; 95% CI, -8.47 to -0.26%). (Kinoshita T, et al, J Crit Care 2023)

Baseline characteristics from Kinoshita T, et al, J Crit Care 2023, by Joel Topf

Figure 2b from Kinoshita T, et al, J Crit Care 2023, showing distribution of serum sodium correction rates and their association with outcomes using three models
This brings us to our current study by Seethapathy H et al, where we seek clarity to the long debated hyponatremia correction rate and its stakes.
The Study
Methods
Study design: A retrospective observational study between January 1, 1993 and December 31, 2018, at two institutions in Boston, Massachusetts.
Study population: All patients over 18 years with an index serum sodium level less than 120 mEq/l in the 24 hours preceding or 24 hours after the recorded time of admission.
Exclusion criteria: Patients with no availability of follow-up serum sodium value at admission or after 24 hours of admission, if the index blood sample was hemolyzed, or if the glucose value was greater than 300 mg/dl (>16.7 mmol/L).
Definition of exposure: The correction rate (mEq/l/24 hours) was calculated by the serum sodium level at 24 hours and the serum sodium at admission.
Correction rate = Na24 - Napre
Sodium 24 hours = Na24=Napre+[(Napost–Napre)·(24–Tpre)/(Tpost–Tpre)]
For example:
Napre = 110 mEq/l; Napost = 120 mEq/l; Tpre = 08 am; Tpost = 8pm
Na24=110 +[(120–110)·(24–8)/(20 pm –8 am)]
Na24=123
Correction rate = 13mEq/l/24 hours
The cohort was then divided into three groups according to predetermined correction rates: <6 mEq/l/24 hours, 6-10 mEq/l/24 hours, and >10 mEq/l/24 hours. The group within the sodium correction rate between 6 and 10 mEq/l/24 hours was chosen as the reference group.
Outcomes: Mortality rates (in-hospital and 30-day mortality), length of stay, and incidence of CPM within 90 days of hospitalization with severe hyponatremia.
Information about patient mortality and the duration of their hospital stay was obtained directly from their medical records. To gather data on CPM, two strategies were employed. First, the use of diagnostic codes from the 9th and 10th revisions of the International Classification of Diseases (ICD) for ODS or CPM. Secondly, the natural language processing text from MRI reports from the first 90 days of each patient’s admission was analyzed. This analysis involved searching for specific terms such as “osmotic,” “demyelination,” “pontine,” “myelinolysis,” “edema,” “correction,” and “hyponatremia.”
Finally, a manual review was conducted on the clinical presentation and progression of all patients diagnosed with CPM.
Statistical analyses: To examine the association between correction rates and mortality univariable models, multivariable-adjusted logistic regression models and propensity score-weighted analyses were performed. Also, multivariable models were performed to examine the association between correction rates and length of stay.
Sensitivity analyses were performed, comparing less than 8 mEq/l/24 hours versus greater than 8 mEq/l/24 hours.
All encounters were used to identify incident CPM within 90 days of hospitalization.
Results
There were 13,429 patients with sodium levels less than 120 mEq/l, and 3274 were eligible per inclusion criteria (Figure 1).

Figure 1. Study flowchart of patients, from Seethapathy H, et al, NEJM Evid 2023
The mean age was 66 ± 16 years and 57% were female. Average eGFR was 73 ± 34 ml/min/1.73m2. Most common comorbidities were malignancies (37%), chronic obstructive pulmonary disease (36%), congestive heart failure (32%), cirrhosis (10%), and 24% had psychiatric diseases. 18% of patients were on loop diuretics and 10% on thiazides, although it is unclear if these groups overlapped. Additionally, 13% were on antipsychotic agents, 12% on SSRIs, and 5% on tricyclic antidepressants.

Table 1. Baseline clinical characteristics from Seethapathy H, et al, NEJM Evid 2023
Mean serum sodium on admission was 116 ± 4 mEq/l with serum osmolality 257 ± 22 mOsm/kg. The average sodium correction in the first 24 hours was 9 ± 7 mEq/l and the sodium at discharge for these patients was 132 ± 6 mEq/l.
The sodium correction rates included three groups:
1) less than 6 mEq/L/24 hours (38%),
2) 6 to 10 mEq/L/24 hours, the reference group (29%)
3) greater than 10mEq/l/24hours (33%)
Of note, 12% of patients received hypertonic saline and 3% of desmopressin use within the first 24 hours of admission.
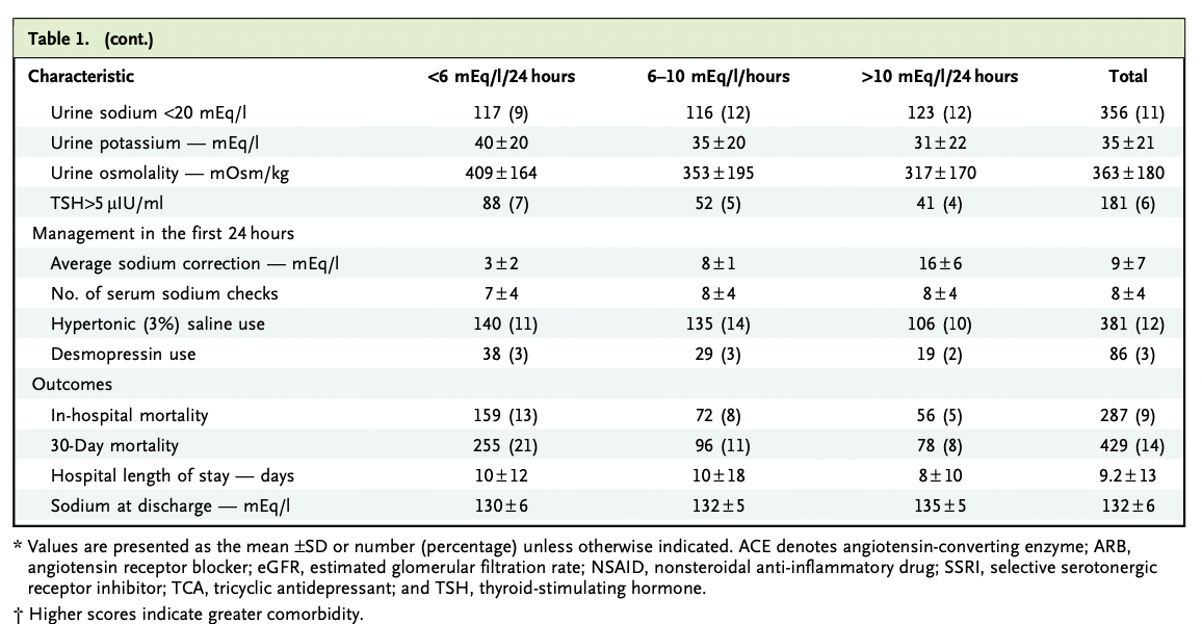
Table 1 (continued) Baseline clinical characteristics from Seethapathy H, et al, NEJM Evid 2023
Historically, the average 24h correction rate was 12.1 mEq/L/24h in 1993 and 7.8 mEq/L/24h in 2018.

Figure S1. Average 24-hour sodium correction rate of severe hyponatremia by year of study, from Seethapathy H, et al, NEJM Evid 2023
Outcomes
There was higher in-hospital mortality (Odds Ratio 1.71 with 95% CI 1.27-2.31) and 30-day mortality (OR 2.13 with 95% CI 1.64-2.77) in the group with <6 mEq/l/24h correction rate vs correction 6-10 mEq/l/24h.
A sodium correction rate above 10 mEq/L/24 hours showed decreased in-hospital (OR 0.64; 95% CI, 0.44-0.93; table 2) and 30-day mortality (OR 0.69; 95% CI, 0.50 to 0.96; table S2) on univariable and multivariable models. Also, this group had a shorter average length of stay, 2.2 days (95% CI, 1.0 to 3.3) compared with the reference group.
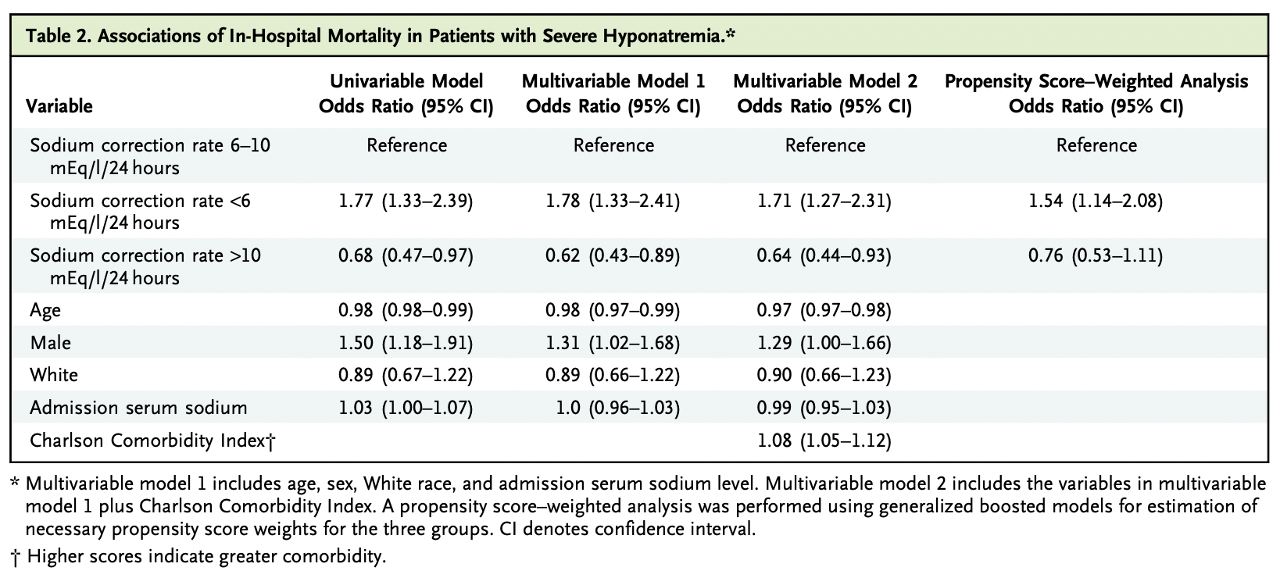
Table 2. Associations of in-hospital mortality in patients with severe hyponatremia from Seethapathy H, et al, NEJM Evid 2023
In addition, propensity score-weighting analysis showed that >10 mEq/l/24 hour sodium correction had no association with mortality when compared to a correction rate of 6 to 10 mEq/l/24h (table S2), while correction rates <6 mEq/l/24h did have an increased mortality association for both in-hospital and at 30 days follow-up.

Table S2. Associations of 30-day mortality in patients with severe hyponatremia from Seethapathy H, et al, NEJM Evid 2023

Table S5. Association of in-hospital mortality in patient with severe hyponatremia, from Seethapathy H, et al, NEJM Evid 2023
In a subgroup analysis, a rate greater than 10 mEq/l/24 hours showed a decrease in 30-day mortality in patients with cirrhosis (OR 0.3,95% CI, 0.09-0.85). In patients with cancer or heart failure, sodium correction <6 mEq/l/24h was associated with higher in-hospital and 30-day mortality.

Figure 2. Forest Plot showing the association between sodium correction rates and mortality from Seethapathy H, et al, NEJM Evid 2023
Central Pontine Myelinolysis (CPM)
There were 723 MRIs performed in 537 patients over the next 90 days, of which 216 had positive keywords for ODS or CPM, and no additional patients were identified using the diagnostic codes. Manual review of these 216 MRI reports led to 7 patients with CPM (0.2% of the cohort). Admission serum sodium for 4 of these patients was <110 mEq/l (with 1 patient <106 mEq/l), and 3 patients had serum sodium between 110-118 mEq/l. This means that CPM frequency in the cohort with admission sodium <106 mEq/l was 1.3%, and was 1.2% in those with admission sodium 106–110 mEq/l.
Only two patients had correction rates >10 mEq/l/24h (and they both ultimately experienced full neurological recovery), while 5 out of 7 had correction rates 3–8 mEq/l/24h (2 of whom had a protracted neurological course). None died within 12 months of admission. Six out of 7 of the patients with CPM had some combination of malnourishment, alcohol use disorder, cirrhosis, hypophosphatemia, and hypokalemia.

Table 3. Characteristics of patients with central pontine myelinolysis from Seethapathy H, et al, NEJM Evid 2023
Discussion
The results show that higher rate sodium correction was associated with lower mortality compared with slower rates, in a large cohort with 25 years worth of data. These results tally with multiple previous observational studies (George et al CJASN 2018 over 7 hospitals with N=1490, MacMillen et al NEJM Evidence 2023) over 5 hospitals with N=22,858), as well those undertaken in an ICU specific population (Kinoshita T, et al, J Crit Care 2023). However, as would be expected, the slow correction groups consistently have an increased burden of co-morbidities such as cirrhosis, heart failure and metastatic cancer. The current study does provide the statistical adjustment for co-morbidities, and also provides results within the disease-specific subgroups which do show that the mortality difference at different correction rates still remained. But as with all observational trials, residual confounding can still exist, and it seems reasonably likely that some unmeasured unit of ‘how sick the patient is’ is unaccounted for, rather than a few mmols of faster correction being causative in mortality figures, especially as the causes of death were ‘sodium-unrelated’ in the vast majority of cases. The authors note that slower correction of hyponatremia in patients with heart failure, cirrhosis, or metastatic cancer does provide you with some prognostic information, but it is hard to know if this will be clinically actionable. The same pattern plays out for length of stay data, with slower correction meaning significantly longer stay. However, this in itself will not persuade any nephrologist to speed up correction if a slightly longer stay means avoiding CPM, so we will examine this evidence next.
In total, 16% of the population had MRI head imaging within 90 days of admission, and this study then looked for MRIs confirming features of both ODS and CPM. The observed frequency in the total cohort was low at 0.2%, though this rose to over 1% in patients whose admission sodium was <110mEq/l, the group that we know we should worry about most. It is possible that subtle cases were missed, and it can also be a clinical diagnosis without radiological features, so that the actual frequency could be higher still. There is no universal diagnosis of the term ‘rare’, but anecdotally, many clinicians have thankfully never witnessed firsthand this bogeyman of rapid sodium correction, and are therefore eager to digest these large datasets further to examine risk factors for its appearance.
There was poor correlation between development of CPM and the rapidity of sodium correction in this study, with 5 out of the 7 patients having correction rates 3-8 mEq/l/24h. Indeed, though the other 2 had faster correction rates, they also both did well neurologically. What was striking was that 6 out of the 7 patients who developed CPM had other risk factors for CPM that, on admission, are beyond our control, such as alcohol misuse and malnutrition. These patients may have a certain degree of risk of CPM, no matter how expertly the nephrologist controls their rise in sodium, and this finding isn’t limited to the current study.
A recent retrospective study by MacMillan TE, et al, NEJM Evid 2023, found 12 cases of ODS in their cohort, and 7/12 did not have fast rates of correction (>8mEq/l/24 hours). Again, this observational study was not able to comment on causal factors, or what would have happened if their centers in Canada were not practicing with caution, as is the modern approach to hyponatremia. In results resonating both with the current study and clinical practice, serum sodium levels less than 110mEq/l/24 hours, positive alcohol levels, and hypokalemia were more common within the ODS group. However, not all of these large, recent observational studies had the conclusion that ODS was only loosely associated with rate of sodium correction - for example, the N=1490 study mentioned above (George et al CJASN 2018) there were 8 cases of ODS and 7 had hyponatremia correction rates >8mEq/l/24hr (though 5 also had neurological recovery).
The interpretation of the above has sparked great controversy within the nephrology and general internal medicine communities. We all want the best for our patients, and we all fear the ODS. This is not just because of the neurological sequelae, but also because, unusually, the events that are felt to cause it happen after admission, and which are thought to be preventable, when the management strategy is reviewed retrospectively. For those clinicians feeling guilty about a patient with CPM they have seen, there will be some solace to see that actually it often happens in the absence of rapid correction. Though we’d love to be able to control and prevent all poor outcomes for our patients with hyponatremia, there may be a cohort of patients who are at risk of CPM no matter what we do after admission, for whom we have limited agency. However, there have been whispers on social media of doctors whose attitude is now laissez-faire with regards to correction rates, in response to the recent flurry of observational hyponatremia studies.
Saying that some cases of CPM are unrelated to the rate of sodium correction, does not mean that no cases of CPM are prevented by careful sodium correction. This is supported by the fact that we now correct sodium, on average, much more slowly than historical case reports, and are also reporting lower CPM rates. Indeed, even in the cases that seem like there was no rapid correction are not definitive (as there could have been unwitnessed rapid correction in the community).
Something being ‘rare’ when the clinical culture is slow correction, doesn’t necessarily mean you can relax your rules. Rarity of occurrence of a feared complication may instead be supportive of the fact that your guidelines are working in the right direction.
It is hard to know where the burden of proof now lies. We are left to wonder if our guidelines would have advocated so strongly for slower correction, had the large observational studies we have today come out before the much smaller cohorts on which they were drafted. There’s no denying that we would like to be certain that the effort, cost and patient discomfort in undertaking slow correction is worth it. There have been calls for prospective trials, but given the rarity of the CPM as an outcome and (one could imagine) a reluctance to randomize certain patients to different correction rates, it may not be realistic that we’ll get our questions answered about high risk patients via this route any time soon. In the meantime, we will all remain open to this high-quality observational evidence, even if sections of it threaten to force us to rethink hyponatremia mantras that we’ve taken as a fact for years.
Conclusion
This study of a large cohort of patients with hyponatraemia found lower mortality rates associated with a higher rate of sodium correction, in keeping with previous literature. There is agreement that patients with more severe hyponatremia in the context of alcohol misuse, malnutrition, or other electrolyte abnormalities are at the very highest risk for CPM, but there remains debate and uncertainty about the strength of causality derived from slightly faster rates of sodium correction.
Summary by