
#NephJC Chat
Tuesday December 11, at 9 pm Eastern Standard Time
Wednesday December 12, at 8 pm GMT, 12 noon Pacific
Science. 2018 May 18;360(6390):758-763. doi: 10.1126/science.aar2131. Epub 2018 Apr 5.
Single-cell transcriptomics of the mouse kidney reveals potential cellular targets of kidney disease.
Park J, Shrestha R, Qiu C, Kondo A, Huang S, Werth M, Li M, Barasch J, Suszták K.
PMID: 29622724
And
Cell Stem Cell. 2018 Nov 1. pii: S1934-5909(18)30491-0. doi: 10.1016/j.stem.2018.10.010. [Epub ahead of print]
Comparative Analysis and Refinement of Human PSC-Derived Kidney Organoid Differentiation with Single-Cell Transcriptomics.
Wu H, Uchimura K, Donnelly EL, Kirita Y, Morris SA, Humphreys BD.
PMID: 30449713


This week we will discuss two recently published papers that have launched kidney science into the spotlight. These studies, which have been widely read across disciplines, used single-cell RNA sequencing (scRNA-seq) technology to highlight the beauty and complexity of the kidney. The first study, “Single-cell transcriptomics of the mouse kidney reveals potential cellular targets of kidney disease,” is from Katalin Susztak’s group and highlights how scRNA-seq data of mouse kidneys can be leveraged to discover novel cell types that may cause human disease. The second study, “Comparative Analysis and Refinement of Human PSC-Derived Kidney Organoid Differentiation with Single-Cell Transcriptomics,” is from Benjamin Humphreys’s group and benchmarks kidney organoid differentiation protocols with integrative analyses of scRNA-seq data, demonstrating how scRNA-seq findings can be used to optimize organoid culture. Please join us to meet the authors and discuss the highlights of these papers.
Introduction
The kidney is a magnificent organ composed of many cell types that coordinate to perform life-sustaining physiological tasks. As a nephrologist, I love the kidney because it is so wonderfully complex and interesting. However, as a physician-scientist trying to study the kidney, this level of complexity poses major challenges, especially when trying to determine which genes are important and where, in the kidney, they exert their effects. During the scRNA-seq session at Kidney Week 2018, Dr. Susztak brilliantly captured the essence of this problem in posing the following question to the audience:
“In the mid-1980s, the average starting salary of geography majors at the University of North Carolina was over $100,000 ... Why?”

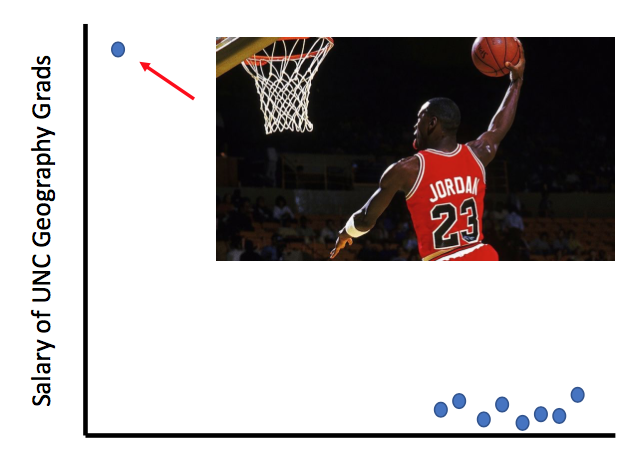
Dr. Susztak then informed the audience that this piece of data, although true, is not representative of all UNC geography majors in the 1980s. The mean value was driven by one graduate with a mean slam dunk, Michael Jordan. In the kidney, grinding up and lysing a whole kidney to perform traditional bulk RNA-seq or even a western blot gives you information on the mean signal across multiple cell types. However, in the case of Michael Jordan, we can miss an essential truth if the data distribution is severely skewed. How would we know which cell type is the MVP driving a particular disease process in the kidney?
Here is where scRNA-seq comes in. This technology captures the expression of tens of thousands of genes within each cell and allows us to see how gene expression patterns differ from cell to cell. Although in the past scientists attempted to introduce more specificity in their transcriptomic profiling by microdissecting structural components of the kidney (such as the glomerulus), each microdissected sample still contains multiple cell types. In addition, bulk RNA-seq does not directly provide information on spatial or developmental relationships among cells. ScRNA-seq allows us to gain high-resolution insights into heterogeneous cell populations (Karaayvaz et al. Nature Communications 2018), identify rare but causal cells in disease (Ledergor et al. Nature Medicine 2018), and study novel developmental processes and cell fate decisions (Lindström et al. Developmental Cell 2018). Currently, the Human Cell Atlas Project is underway and will make a scRNA-seq reference map of all human cells to understand how specific cell populations and sub-populations contribute to disease. We will review the overall scRNA-seq workflow in the Methods section.
Below, I will summarize some of the highlights from the two papers selected for NephJC discussion this week. The first paper on deck for discussion is the Science paper from the Susztak group. They characterized around 57,000 single cells from healthy mouse kidneys and found a novel cell type in the distal tubule that may have implications for acid/base handling in chronic kidney disease (CKD). The second paper is the Cell Stem Cell study from the Humphreys group. They compared kidney organoid differentiation protocols by sequencing around 83,000 cells from 65 organoids differentiated from pluripotent stem cells, and they compared these transcriptomes to that of human fetal kidney and human adult kidney. Their analyses revealed a strategy for reducing the development of non-kidney cell types in the organoid model system.
If you are interested in reading more scRNA-seq kidney literature here are some key references:
Wang et al. Dissecting the Global Dynamic Molecular Profiles of Human Fetal Kidney Development by Single-Cell RNA Sequencing Cell Reports 2018.
Ó hAinmhire et al. A conditionally immortalized Gli1-positive kidney mesenchymal cell line models myofibroblast transition AJP – Renal Physiology 2018.
Qiu C et al. Renal compartment-specific genetic variation analyses identify new pathways in chronic kidney disease. Nature Medicine 2018.
Lindström et al. Conserved and divergent features of mesenchymal progenitor cell types within the cortical nephrogenic niche of the human and mouse kidney JASN 2018.
Cao et al. Joint profiling of chromatin accessibility and gene expression in thousands of single cells. Science 2018.
Menon et al. Single-cell analysis of progenitor cell dynamics and lineage specification in the human fetal kidney. Development 2018.
Young et al. Single-cell transcriptomes from human kidneys reveal the cellular identity of renal tumors. Science 2018.
Wu et al. Single-cell transcriptomics of a human kidney allograft biopsy specimen defines a diverse inflammatory response. JASN 2018.
The Studies
Methods
To obtain a higher resolution picture of cellular transcriptomics in a complex organ such as the kidney, scientists have been turning to scRNA-seq. Currently several platforms exist for making single-cell libraries, but for the sake of simplicity I will introduce the droplet-based method used in both of these papers, and more specifically the 10X Chromium method used in the Susztak paper. Other downstream analyses will be summarized with the presented data, but for now I will give an overview of droplet-based scRNA-seq, which can be summarized in the following steps:
Step 1: Make a single-cell suspension from a sample.
A tissue or organoid sample needs to be broken down into its single-cell components to make a suspension of living, intact single cells (#NephJC Figure 1). This is perhaps one of the most challenging aspects of the scRNA-seq workflow because complex tissues such as the kidney have sensitive cell types (e.g., podocytes) that are likely to die during dissociation and thus not get represented in the sequencing. In some tissue samples, for example a diseased kidney, this is especially difficult if some degree of fibrosis is present. We tend to target over 80% viability in a sample to minimize the capture of “ambient” RNA from neighboring dead cells that would not provide informative data.

#NephJC Figure 1.Step 1 of the scRNA-seq workflow is to create a suspension of viable single cells dissociated from a complex tissue sample, such as a human kidney biopsy or section of kidney from an animal model.
Step 2: Give each cell a unique ID code that gets added to its transcriptome.
Each cell needs to be marked for identification purposes so that data from a single cell can later be identified as originating from that specific cell. This means we need to give lucky podocyte #13, for example, an ID barcode sequence, and tag all of its RNA transcripts with that barcode. With the ID barcode, we can later find all the RNA transcripts from podocyte #13 and not confuse them for the transcripts from proximal tubule cell # 524 (#NephJC Figure 2A).
Now let's take it a step further. Each transcript is also marked with a unique molecular identifier (UMI) that is sequenced. We would expect there to be more than one copy of NPHS1 in podocyte #13, and each NPHS1 RNA molecule gets a different UMI but the same podocyte #13 ID cell barcode (#NephJC Figure 2B). The UMI system allows us to count transcripts and also identify PCR duplicates, which are technical artifacts from making the library rather than representative of the biology of the cell.
This whole ID process is important because to make scRNA-seq more efficient and scalable, we pool together, or multiplex, all of the molecular materials from all the cells of a sample together into what we call a "library." Multiple libraries can be sequenced together on the same machine, and the libraries (marked by another type of barcode called sample index) can be demultiplexed, with cell barcodes and transcript UMIs sorted out by a computer program on the back end.
How does this all happen at the bench? Once a single cell suspension is made with greater than 80% viability across cells, the cells enter a microfluidics system where each single cell is injected, in combination with a gel bead, into an oil-based droplet (#NephJC Figure 2C). Each gel bead contains a different cell barcode to identify the cell, as well as UMIs to identify transcripts. Inside each droplet (or GEM as 10X calls it), RNA from the single cell is reverse-transcribed into complementary DNA (cDNA), incorporating the barcodes and UMIs in the process.

#NephJC Figure 2.Step 2 of the scRNA-seq workflow is to make unique droplets, with each droplet containing a single cell and a gel bead with cell barcode and UMIs. (A) Conceptual representation of cell barcodes. Thank you to Dr. Josh Waitzman (@jwaitz) for the SpongeBob inspiration. (B) Visual representation of how cell barcodes and UMIs get incorporated into the cDNA that will be incorporated into a sequencing library. (C) The microfluidics of the 10X Chromium system. Oil, cells with reverse transcription reagents, and gel beads are added into separate wells of a microfluidics chip. Inside the 10X Chromium machine, the gel beads are combined one by one with a single cell into a droplet 10X calls a GEM. Most droplets will contain a combination of a single cell and a single gel bead. Some droplets will have only gel beads, while others may have doublet cells if dissociation was not successful.
Step 3: Make cDNA libraries from the gel beads containing single-cell cDNA material.
To do this, the GEMs are lysed. Then the cDNA is cleaned up and amplified by PCR into a library of sequences to be read. Each library usually is one replicate sample, so a sample index barcode is incorporated into the library sequences so that this replicate can be identified and demultiplexed from other libraries that may be sequenced in the same flow lane at the same time.
Step 4: Have the libraries sequenced.
Massively parallel sequencing usually happens at a core facility within an academic institution or at a company.
Step 5: Demultiplex and analyze the data.
After the sequencing is run, reads from the library are sorted (de-multiplexed), through computational methods that then generate a differential gene expression matrix (#NephJC Figure 3A). A series of quality-control steps are taken to minimize technical artifacts and low-quality reads. Once the filtered reads are ready to go, you'll see that the data are very "multi-dimensional" because you are comparing tens of thousands of genes expressed in one cell to the same large number of genes expressed in a different cell but in a different pattern. Most analytical methods reduce the high-level of multi-dimensional data into fewer dimensions that can be more easily visualized and interpreted, and principal component analysis, a linear dimensionality reduction method, is a popular way to do this. A non-linear dimensionality reduction method is t-distributed stochastic neighbor embedding (t-SNE), which allows you to visualize high dimensional datasets such as scRNA-seq data (#NephJC Figure 3B).
For a t-SNE plot, local structure relationships among cells is calculated, and probability distributions project the data into isolated clusters of cells. This workflow is commonly performed using the Seurat pipeline. Clusters of cells are determined based on relative enrichment of marker genes (podocytes for example are marked by NPHS1) and can be refined according to different levels of resolution and even sub-clustering. There are other types of analyses (e.g. pseudotemporal ordering using Monocle which will be touched upon later) that can be performed, but this should hopefully be a good starting place for getting familiar with the papers selected for #NephJC discussion.

#NephJC Figure 3.(A) Gene expression matrix with demultiplexed read counts. (B) t-SNE plot of cell clusters. Each cluster of a different color represents a separate cell type determined by relative enrichment of marker genes.
Results
Single-cell transcriptomic profiles of kidney model systems
Both groups present the single-cell transcriptomic profiles of the samples they sequenced. In the Susztak paper, we see some of the usual suspects we hope to find on the t-SNE plot in Susztak Figure 1A. Every dot represents a cell, and this is how the cells cluster by cell type. You'll notice that cluster 2 is podocytes, and cluster 3 is proximal tubule, which be further subclustered there on the left. These clusters are determined by relative enrichment of marker genes, which you can see down in the corresponding violin plot (Susztak Figure 1B), which shows a visualization of how many cells from each cluster express each marker. For podocytes (cluster 2), we would expect enrichment for NPHS1 (nephrin) and NPHS2 (podocin). You can see these marker genes are not highly expressed elsewhere. Notice in the violin plot cluster 8 includes markers for both principal and intercalated cells. We will come back to this later.

Susztak Figure 1.(A) t-SNE plot of mouse kidneys. The clusters are numbered 1-16, with their identities revealed to the right of the table. (B) Violin plots of marker genes for each cell type cluster.
The Humphreys paper also presents how the sequenced kidney organoid cell types cluster. The marker genes here are presented as heatmaps (Humphreys Figure 2A and 2B), although violin plots are presented in Supplemental Figure 1 of the paper. In the heatmap, dark bands represent expression of marker genes in relevant clusters, so PODXLand NPHS2 mark podoctyes and are not really expressed elsewhere. M denotes the Morizane kidney organoid differentiation protocol, and T denotes the Takasato differentiation protocol. The paper also presents visualized clusters of the organoids they sequenced in t-SNE plots (Humphreys Figure 2C and 2D). You'll see that there are podocytes in differing relative abundance, proximal and distal tubules, and even neurons and muscle cells. We will come back to these off-target cells later.

Humphreys Figure 2.(A) Heatmaps of marker genes for Morizane (M) and Takasato (T) differentiation protocols. (B) t-SNE plots for each type of organoid.
Cell-type specificity of disease-associated genes in kidney model systems
Next, both papers tackle the connection between cell type and genes associated with human disease. In the Susztak paper, Susztak Figure 2 shows where disease-associated genes are expressed in the mouse kidney. Looking at these heatmaps, you can see that most genes are cell-type specific. For example, in nephrotic syndrome, you can see that these genes are primarily in the podocyte - a straight yellow line down (Susztak Figure 2A). Renal tubular acidosis is not surprisingly enriched for genes expressed in the intercalated cells of the collecting duct (Susztak Figure 2A). We also see predominantly one cell type expressing each disease-associated gene found in CKD genome-wide association studies (GWAS), which identify novel genes associated with complex traits such as CKD (Susztak Figure 2B).

Susztak Figure 2.(A) Heatmaps of genes associated with monogenic diseases (labeled on right) and cell type (labeled on top). Most genes are expressed in podocytes for nephrotic syndrome and intercalated cells of the collecting duct in renal tubular acidosis. (B) Heatmaps of GWAS genes (labeled on right) and cell type (labeled on top).
Interestingly, we see a similar pattern in Humphreys Figure 5, which shows mapping of GWAS hits to a human adult kidney biopsy his group had sequenced on the single-cell level. However, the organoids did not express many of these same genes.

Humphreys Figure 5.(C) Heatmap of GWAS genes (labeled on right) and cell types (labeled on bottom) of human adult kidney. (F) Heatmap of GWAS genes (labeled on right) and cell types (labeled on bottom) of human kidney organoids. Fewer GWAS genes are expressed in the organoid system.
This is likely due to the relative immaturity of the organoids, which do not completely overlap in terms of cluster expression patterns, with the adult kidney seen in pink on the combined t-SNE plots in Humphreys Figure 4E. This is further broken down in looking at mature podocyte and tubular markers. The dark red squares (and blue arrows) represent expression of marker genes in the adult kidney (Humphreys Figure 4F). These markers include NPHS1 for the podocyte and LRP2 for the proximal tubule. There is faint NPHS1 expression in the organoids but no expression of LRP2. However, there are more developmental markers expressed in the organoids and none in the adult kidney.

Humphreys Figure 4.(E) t-SNE plot of the two organoid types and adult kidney; the organoids mostly overlap whereas the pink adult kidney cells have non-overlapping clusters. (F) Heatmap of mature and developmental markers. Cell types and which system (Morizane organoid, Takasato organoid, or adult kidney) are denoted on the right. Adult kidney expression is emphasized with the blue arrows, with red boxes indicating stronger expression.
Novel findings from each study
These cutting-edge efforts to see the kidney in single-cell resolution paid off for both groups, as they reported novel findings. In the Susztak paper, remember I pointed out that cluster 8 included markers for both principal and intercalated cells (#NephJC Figure 4A)? The Susztak group decided to explore this cell type further as it may have implications for acid/base handling in human disease. They stained for principal cell and intercalated cell markers and found in lower abundance the presence of cells that stained positive for both, validating the scRNAseq data (#NephJC Figure 4B). A different type of scRNA-seq analysis called pseudotemporal ordering, which is performed by a program called Monocle, can show how similar cells are to each other based on similarity of gene expression profiles. Using traditional principal cell and intercalated cell markers for branchpoints, the Susztak group found that the novel cell type in blue indeed sits between the two cell types in terms of similarity and is thus a transitional cell type (#NephJC Figure 4C). If it were really an intercalated cell, the blue dots would sit towards the right, but instead, they are in the middle between the two cell types. This is also confirmed by lineage tracing experiments in mouse, where you have GFP expressed in cells with an ATP6ase lineage tag (#NephJC Figure 4D). In examining gene expression differences between principal cells and intercalated cells, the Notch signaling pathway came up with differences in ligand and receptor expression according to cell type (see Susztak Figure 4A in paper). Turning on Notch expression in adult mouse kidney disrupted collecting duct cell patterning with increased principal cell markers. This was also seen in the folic acid model of renal fibrosis in mice, which was tested due to the known involvement of Notch in renal fibrosis and CKD (#NephJC Figure 4E). Consistent with the change in collecting duct phenotype and renal tubular acidosis, serum bicarbonate was not detected in the folic acid mice (#NephJC Figure 4F). Taken together the intercalated cell to principal cell transition might be mediated by the Notch pathway, and a shift toward the principal cell fate may modulate metabolic acidosis in renal fibrosis of mice and potentially CKD patients.

#NephJC Figure 4.(A) Adapted from Susztak Figure 1B – zooming in on violin plots of Clusters 6-8. (B) Adapted from Susztak Figure 3C. Yellow circle marks a cell expressing both Aqp2 (principal cell marker) and Atp6v1b1 (intercalated cell marker). This cell is considered a “double positive” transitional cell. (C) Adapted from Susztak Figure 3G. Monocle pseudotime trajectory shows the relationship of the different cell clusters to each other, with the novel cluster 8 being a transitional cell type between principal (pink) and intercalated (green) cells. (D) Adapted from Susztak Figure 3I. ATP6ase lineage tag is marked by GFP. Cells with green, red, and white are transitional cells. (E) Adapted from Susztak Figure 4C and E. More principal cells were present in cell fractions. (F) Adapted from Susztak Figure 4I. Folic acid treated mice had undetectable serum bicarbonate levels.
The Humphreys group leveraged their single-cell data to optimize organoid differentiation protocols. Remember I pointed out that they found muscle and neuron cells in their organoids? In their pseudotemporal ordering analysis, they found a branching point between neuronal-mesenchymal cell fate and podocyte cell fate (#NephJC Figure 5A). They performed a finer receptor-ligand analysis between the podocyte and neuronal-mesenchymal clusters. They found 19 receptors and cognate ligands, and NTRK2 was expressed exclusively in neuronal clusters, and its ligand BDNF was also expressed in the podocyte-neuronal-mesenchyme branch (#NephJC Figure 5B). Because BDNF promotes neuronal survival and differentiation, the authors hypothesized that inhibiting its signal would decrease the growth or formation of neuronal clusters in the organoid differentiation process. They administered an NTRK2 inhibitor to growing organoids and found a 90% reduction of neuronal cells, from about 20% down to 2% and an increase in proximal tubular cells and podocytes (#NephJC Figure 5C and 5D). This experiment shows that this approach and use of scRNAseq can be leveraged to refine and optimize organoid differentiation protocols to reduce off-target cell types and enrich for the types of cells we care about.

#NephJC Figure 5. (A) Adapted from Humphreys Figure 6. Pseudotemporal ordering reveals podocytes branching off before the neuronal-mesenchyme cell fates. (B) Adapted from Humphreys Figure 7A. Ligand-receptor analysis identified a BDNF-NTRK2 interaction, with NTRK2 expressed exclusively in neurons and thus suitable for inhibition to downregulate neuronal differentiation. (C) Adapted from Humphreys Figure 7D. Reduction of neuronal cell population to 2.1% after inhibiting BDNF pathway with K252a. (D) Adapted from Humphreys Figure 7F. IF staining confirming reduction in neuronal marker CRABP1 after K252a treatment.
Food for Thought
Both the Susztak and Humphreys papers highlight the power and promise of scRNA-seq as a tool for elucidating novel aspects of kidney biology and model systems. Their findings would not have been discovered with the use of traditional bulk RNA-seq, emphasizing the importance of studying a heterogeneous organ such as the kidney at single-cell resolution. Of course, with any technology there are technical challenges and limitations. Analytical methods are still in their infancy, and technical noise is still an issue. As always, an exciting new tool is still a tool and not an endpoint, but scRNA-seq can be successfully applied to help answer fundamental questions about kidney biology and disease. Please join us for what is sure to be a lively discussion on the methods and findings of these two papers.
Jennie Lin, MD MTR,
Attending Nephrologist and Physician-Scientist
Northwestern University, Chicago